Blog posts

SUM error in phase MAIN/SHDCRE/SUBMOD_SHDDBCLONE/DBCLONE => ORA-04036: PGA memory used by the instance exceeds PGA_AGGREGATE_LIMIT

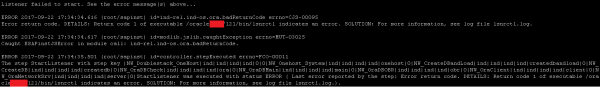
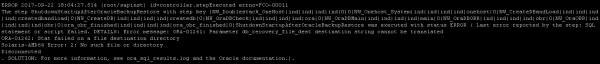
During a support package stack upgrade, in Preprocessing phase of SUM, more explicit MAIN/SHDCRE/SUBMOD_SHDDBCLONE/DBCLONE the following error appeared:


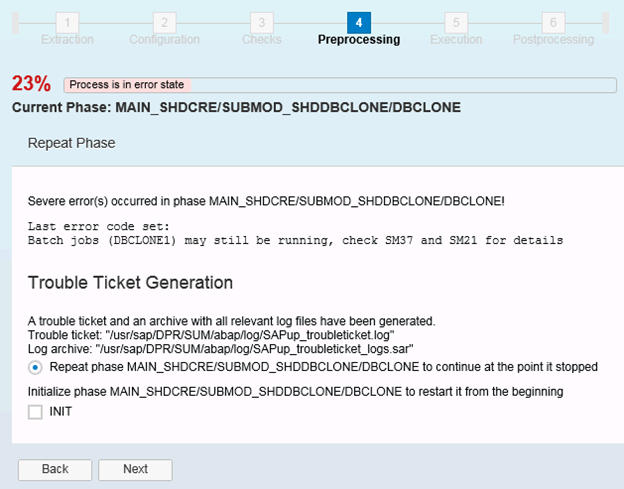
If the upgrade fails during DBCLONE phase, there are not much details of the error that can be found in the logs of SUM.
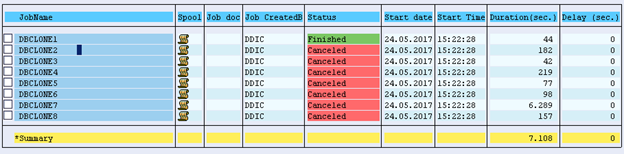
During this stage, the job DBCLONE (that is actually divided in several DBCLONEX jobs running in parallel) is running, so if this job gets canceled it is important to check the job log, syslog and short dumps.


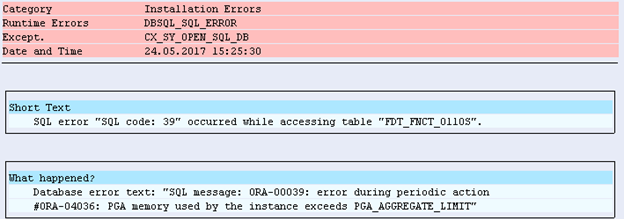
In my case the job was getting canceled with the short dump: DBSQL_SQL_ERROR CX_SY_OPEN_SQL_DB SQL error “SQL code: 39” occurred while accessing table “FDT_FNCT_0110S”. Database error text: “SQL message: ORA-00039: error during periodic action #ORA-04036: PGA memory used by the instance exceeds PGA_AGGREGATE_LIMIT”:


This error can occur under Oracle database 12c, where a new parameter related to PGA, in addition to the already existing PGA_AGGREGATE_TARGET has been introduced => PGA_AGGREGATE_LIMIT.
Until Oracle 12c, the sessions that used memory from the PGA for activities like sorting, group-by, hash-joins etc… could have grown without restrictions, even more than PGA_AGGREGATE_TARGET value, this was only set a a soft limit. It could have happened that this impacted the overall memory usage of the database. That is why PGA_AGGREGATE_LIMIT has to be seen as a hard limit, when it is reached, Oracle will kill the sessions that are using the most untunable memory.
In our case DBCLONE jobs were terminated when the value of PGA_AGGREGATE_LIMIT was reached. In order to solve this you can increase the value of the parameter PGA_AGGREGATE_LIMIT, that I would say it is the recommended method, but you have also the option to deactivate the hard limit, parameter PGA_AGGREGATE_LIMIT, by setting it to 0. In my case setting the parameter PGA_AGGREGATE_LIMIT to 4Gb from the default 2Gb (alter system set PGA_AGGREGATE_LIMIT=4096M scope=both;), was sufficient in order for the job to complete with success. The good part is that the parameter is dynamic, so no restart of the database is necessary to activate the parameter and you also have the option to test the correct value for you, more easily.

SUM error Unable to locate the requested resource

A common problem with SUM, is when the tool is attempted to be started and in browser the following error is being displayed:

SUM error


“Not Found
Unable to locate the requested resource”

Even if after multiple attempts and maybe after a hostagent update, the same error is being displayed.
In this case there is a problem with one of host agent processes that remained hanged and if you check the processes at OS level you will notice 4 processes associated to the host agent:

ps -ef | grep host
root 7183 6053 0 17:29:32 ? 0:08 /usr/sap/hostctrl/exe/saphostexec pf=/usr/sap/hostctrl/exe/host_profile
root 24899 6053 0 15:50:32 ? 0:03 /usr/sap/hostctrl/exe/saposcol -l -w60 pf=/usr/sap/hostctrl/exe/host_profile
sapadm 24829 6053 0 15:50:31 ? 0:02 /usr/sap/hostctrl/exe/sapstartsrv pf=/usr/sap/hostctrl/exe/host_profile -D
root 24826 6053 0 15:50:30 ? 0:00 /usr/sap/hostctrl/exe/saphostexec pf=/usr/sap/hostctrl/exe/host_profile

The first process, that you can see with a different timestamp, it is the hanged one, kill this process and retry opening SUM tool, it should start successfully now.
Normally for hostagent, you should only see 3 process all the time, something similar to this:

sapadm 15877 28579 0 Jun 24 ? 206:27 /usr/sap/hostctrl/exe/sapstartsrv pf=/usr/sap/hostctrl/exe/host_profile -D
root 16692 28579 0 Jun 24 ? 559:45 /usr/sap/hostctrl/exe/saposcol -l -w60 pf=/usr/sap/hostctrl/exe/host_profile
root 15793 28579 0 Jun 24 ? 14:12 /usr/sap/hostctrl/exe/saphostexec pf=/usr/sap/hostctrl/exe/host_profile

SAP Memory Analyzer – MAT – installation and usage

Memory Analyzer is a tool developed in Eclipse that is used to find the cause for the Heap Dump generation in the SAP Java systems. There are several sources from SAP that I will list at the end of the article, but unfortunately this information if a little bit outdated, that is why I would like to clarify here what are the steps that need to be followed in order to install this tool and how can the dump can be analyzed with it.

These are the steps for the installation:

1. The download location is: http://www.eclipse.org/mat/downloads.php
If you have a windows environment you have to download the Windows (x86) kit to your local computer => MemoryAnalyzer-1.7.0.20170613-win32.win32.x86.zip

2. Download the extension pack from the note 1883568 – How to self analyze a Heap Dump using MAT

MemoryAnalyzer-extensions-update-site.zip

3. Unzip MemoryAnalyzer-1.7.0.20170613-win32.win32.x86.zip to your computer and run the MemoryAnalyzer.exe from the mat directory:

4. Install the extension downloaded earlier as follows:

Add the path to extension archive:

And the installation is completed, only a restart of the computer is necessary. That’s it, now the tool is ready to use.

Now, before opening the dump file you have to make sure that you have enough RAM memory available on the machine that you run the heap dump analysis, that is more than the size of the dump. It is possible that for larger dumps, you get this error when opening the file for analysis:

In order to solve this you have to change -Xmx parameter to a higher value from the tool file MemoryAnalyzer.ini located in the mat directory. The value has to be set to at least the size of the dump file:

Now just open the dump file:

The most used option is Leak Suspects Report, this analysis your dump, searches for the memory leak and lists what are the applications/libraries that are causing the problem, split in percentages.

leak suspects

leak suspects

Under each Problem Suspect you should find some keywords, that you can search for on SMP, SCN or if the suspect is a custom code or a third party application you can get in contact with the respective responsible to get to the root cause.
For more information about heap/thread dumps you can find in my post: SAP java heap and thread dumps

Useful related SAP notes and cocumenation:

2063943 – Memory Analyzer Tool stops the heap dump parsing due to insufficient memory

1883568 – How to self analyze a Heap Dump using MAT

https://wiki.scn.sap.com/wiki/pages/viewpage.action?pageId=237307510


SAP Java heap and thread dumps

Definition of thread and heap dump

A thread dump is a snapshot of how the Java threads of the running server processes look at a point in time, whereas a heap dump is a snapshot of the memory of a java process.

Parameters

Automatically, by default, if there is an out of memory situation, the system itself will generate a heap dump. This behavior is assured by the java parameter XX:+HeapDumpOnOutOfMemoryError that you can find in configtool setup:

In case this parameter is deleted, the automatic generation of the dump will not happen. The file will have quite a big size, approximately the size of the java heap size.

Now, there is also a similar parameter -XX:+HeapDumpOnCtrlBreak that it is not set as a default, when this is activated a heap dump will be written together with the thread dump, every time a CTRL_BREAK (win) or SIGQUIT (unix) event is triggered manually or automatically by the system. So if such behavior is not intended, this parameter should be deleted, not to have unnecessary amount of heap dumps generated.

Naming conventions and paths

You can find the dumps in the default location: /usr/sap/SID/instance/j2ee/cluster/serverN. This location is also defined by a parameter in configtool -XX:HeapDumpPath=directory where to save the heap dumps and can be changed, in case for example, you do not have enough space in the default location and you want the dump to be generated somewhere else.
But this parameter path is valid only for dumps that are generated automatically by the parameter -XX:+HeapDumpOnOutOfMemoryError, not also by the parameter HeapDumpOnCtrlBreak.

Heap dumps generated automatically by OutOfmemory errors will have the naming: OOM.hprof and OOM.addons
Heap dumps generated by a user will look like java_pid.hprof and java_pid.addons.
On both situations, these can be found in /usr/sap/SID/instance/j2ee/cluster/serverN.
Standalone thread dumps will have the naming std_serverX.out and can be found in /usr/sap/SID/instance/work/

Generation methods

As of Java 7.3 it is very easy to manually generate a dump, if needed (for example in case of poor performance of the application). Both thread and heap dumps can be generated directly from NWA -> Troubleshooting -> Advanced Troubleshooting -> Thread Dump Analysis or Heap Dump Analysis

Another way to this, but a little bit more complex is from JSMON tool. You can list all the options available like this:

jsmon pf=instance_profile
help => to see all the options available
process sdump idx => to generate a thread dump of a process
or
process hsdump idx => to generate a heap dump of a process

A thread dump can be generated also outside of the system, from Solution Manger. This is how it looks like for Solman 7.1 SP14:

Go to SAP Solution Manager Work Center -> Root Cause Analysis -> System Analysis -> Choose the system for which you want to generated the thread dump -> Expert Links -> Start Embedded -> Thread Dump Analysis -> Trigger Thread Dump for the wanted processes:

Now that we talked about the heap dumps, you can find in my next post how to analyze this memory related dumps and how you can get an idea of what is causing the memory problems: SAP Memory Analyzer – MAT – installation and usage

Useful related SAP documentation:
1004255 – How to create a full HPROF heap dump of J2EE Engine 6.40/7.0
https://wiki.scn.sap.com/wiki/pages/viewpage.action?pageId=237307510
https://wiki.scn.sap.com/wiki/display/ASJAVA/%28JSTTSG%29%28Deploy%29Thread+Dump

Free WEBINAR for SAP memory management on 14.12.2017

Looks like this year Santa Claus did not forget about us admins [sce emoji=”gift”/]. On 14.12.2017 at 14:00 CET, SAP is presenting a free WEBINAR about SAP memory management. Feel free to also register at this link https://webinars.sap.com/ves-id-12255-2017capo/en/registration.aspx. After a successful registration, you should receive a confirmation email. If for any reason, you cannot join at this time, don’t worry, the registration will also be available as an attachment in this note: 2560709 – [WEBINAR] Understanding and Troubleshooting SAP Memory Management. But of course, it would be better to join live, as this way you also have the possibility to put questions on this topic to the SAP experts. See you on Thursday!

**Update: looks like there are plenty of webinars being presented by SAP on regular basis. You can check their calendar and topics from this link:

https://www.sap.com/about/events/finder.html#

Power Note Searcher extension for searching SAP notes

There is one tool that I like very much and it helps me in my daily work, I thought I would share it with you guys. The tool is free, so you can give it a try if interested.
It is called Power Note Searcher and it helps to open and find SAP notes in the quickest time possible with the smallest amount of effort. No, it is not a tool for lazy people, we are called optimizing technicians now [sce emoji=”wink”/]
If you like using Google Chrome as a browser, (I do not really find a good reason for using something else, but let’s not be judgmental now) this might be your new toy to play with.
This is a browser extension, once installed will appear as a small icon next to the site textbox:

power search

For those not so familiar with installing chrome extensions, the procedure is the following. Go to Settings -> More tools -> extentions -> get more extensions -> do a search on “Power Note Searcher” -> add to chrome and that’s it, the little icon will appear on the right side of your website box.
The idea is that you do not have to enter Support Portal and then search for your desired note, you just have to click on the application icon installed in your chrome browser and enter the SAP note. If you do not have any note number, you can also search notes after key words or even topics on SCN or help.sap.com. The plugin will also keep a history of your recently searched notes, a few information about them and the possibility to open your recent notes in PDF format.

power search tool

Of course, this tool redirects you to the Support Portal and you need a S-user to view them, as in a normal case.

If you are using Firefox, you can use a similar tool called SAP Support Note QuickLaunch:

SAP Support Note QuickLaunch

It does not have so many option as Power Note Searcher, but it is the only similar option for Firefox browser. To install it here go to Menu -> Add-ons -> Extension -> Enter SAP Support Note QuickLaunch in the search area and hit install.

How to export/import Java in dual stack systems

In this article I will cover the subject of doing a export/import of Java part of a dual stack system, task that mostly used during a system copy. I would say that is is a topic that is not documented very in detail by SAP, so I hope it will come very handy.
First of all, you have to know that for exporting the Java data, no downtime is required, this is an online task and it is done with the help of SWPM tool.

Preparations

On the target system, make a backup of the below files, as most of them will be overwritten during the import:

1. SAP profiles
2. sidadm environment profiles
3. database profiles $ORACLE_HOME/dbs and if Oracle 12c also /oracle/SID/sapprof
4. listener files from $ORACLE_HOME/network/admin

After all these files are backed up proceed with the following:

1. prepare the location for the source system Java export, no more then 5 Gb should be required
2. Download SWPM tool and extract it
3. Prepare a temporary location for the SWPM logs

export TMP=/usr/sap/SID/temp_sapinst
export TEMP=/usr/sap/SID/temp_sapinst
export TMPDIR=/usr/sap/SID/temp_sapinst
export JAVA_HOME=/usr/sap/SID/SYS/exe/jvm/sunx86_64/sapjvm_4.1.035/sapjvm_4

Export

As root run sapinst on the source system and start the export:

./sapinst SAPINST_USE_HOSTNAME=host_name SAPINST_SLP_MODE=false

Choose the export option:

Give the path to the SAP profiles:

Instances installed will be detected:

Database data is identified:

The database copy was done in this case with database tools, so this option can be selected:

Enter the location where the export will be generated:

If you want to remove the sapinst group that was added to the users:

The summary of the selections made:

Reaching the end of the export:

Import

After the system copy is completed with the help of database tools and also the postprocessing of the ABAP part was done, Java can be imported on the target system.
Prepare the environment parameters and start sapinst with root:

export TMP=/usr/sap/SID/temp_sapinst
export TEMP=/usr/sap/SID/temp_sapinst
export TMPDIR=/usr/sap/SID/temp_sapinst
export JAVA_HOME=/usr/sap/SID/SYS/exe/jvm/sunx86_64/sapjvm_4.1.035/sapjvm_4

Also some archives need to be downloaded from support portal beforehand, kits that will be requested during the import procedure: Kernel, Oracle client, Java component

./sapinst SAPINST_USE_HOSTNAME=host_name SAPINST_SLP_MODE=false

Choose the correct option:

In order to be able to customize some options, select custom:

Download the correct kernel archive for your system and select it here:

Enter the system parameters:

DNS name:

Enter the password for the users that will be created:

Select homogeneous system copy, as the system copy was already done via backup/restore with database tools:

Select database data:

Database version:

If you have Oracle 12c, hopefully installed your software with user oracle, so choose it:

Some more database related parameters:

Enter Oracle passwords:

Listener information:

Enter the path to the Oracle instant client software, that you have to download:

The database is already recovered and running, so choose the appropriate option. OPS$ users can be deleted, as SSFS is implemented:

Key phrase for secure store:

Enter the path to the Java component archive:

You can choose the system numbers for your instances:

Enter message server internal port for SCS:

J2EE_ADMIN password:

SDM password:

No need to install the webdispatcher:

Exit option that does not need to be selected:

DDIC password:

Archives will be unpacked:

If you want to remove the groups sapinst from the users:

Summary of your selections:

Import is now in progress:

Probably that during the import, you will face the following errors that are generated because the database configuration that already exist,s will be overwritten with a default one.
Copy back the old files that you saved over:

Listener files:

Oracle pfile and spfile:

After replacing the files with the old ones, the import should continue with success.

SAP Guided Answers, a new tool for troubleshooting SAP errors

As you might have noticed, lately SAP is really investing in making their technical support much better in several ways: by redesigning the support portal through the new SAP Launchpad, yes I know that this not going also as fast as expected and that there are some sudden unexpected interruptions, exactly when you need it more 🙂 and for the new users maybe it is a little difficult to find things, but hey, it is a big progress, if you remember the old and dull service.sap.com. Also expert chat, schedule an expert, non-technical chat, expending the Wiki, SCN, blogs sections, releasing new KBAs for different basic topics, some of them even with videos, developing the SuccessFactors and OpenSAP applications and so on, these are all part of SAP initiative for improving their support service. Maybe not all the solutions are as helpful as expected, but for sure SAP is trying and I think it has improved a lot in this area and finding information is starting not to be a problem anymore.
One tool that is rather new and interesting to use is called SAP Guided Answers. At the moment there are 484 articles, maybe this is not so much at the moment, but I am sure that this will get much popular in the future and that the topics covered will extend. These are not just some simple articles written, but it is also interactive by guiding you through find a solution, depending on your error scenario, you can follow different decision trees.
What is really cool is that this is also integrated in the knowledge base search from Support Portal, so you do not have to do a separate search when you are interested in finding an answer to a specific problem:

You also have an option to write a feedback depending on your experience, so you can also contribute on making this application better.
You can access the application from here, I am sure that you will find something new and useful:

https://ga.support.sap.com/dtp/viewer/

How to calculate how much memory is available to use for SAP and Oracle on Linux?

Finding how much memory is available on Linux system may probably, not seem to be a complicated task. But do we really know how to extract this information correctly? I can assure you that this information is a little bit more difficult to find out, than it seems to be.
The information from ST06 is not accurate and if you want to check it out from OS level, you need to know exactly where to look.
The command for finding out the memory information is the free command:

free -m displays the memory in Mb, the free -g presents the results in gigabytes and if you add the “t” option, it will add also display the swap information:


Let’s have a look on the command and see what do the values displayed mean?

(1) => the amount of physical memory the server has
(2) => the amount of memory that is in use now
(3) => the amount of memory that is currently free
(4) => the amount of shared memory is currently used by the system
(5), (6) => the amount of cached memory that the kernel is using for filesystems buffers, etc …
(7) => the amount of memory that is really used
(8) => the amount of memory that can be free when the linux kernel will try to release it, if an application tries to allocate more that what it is free at (3). It is calculated from the values from the first line: free + buffers + cached (3) + (5) + (6)

Conclusion:

The amount of free memory from the second line cannot be considered entirely free, in case SAP and databases are running on that server, because some of the cached memory is already actively occupied by the SAP shared memory and database caches and these memory areas are needed by the applications.
So what amount of memory can be really considered available in case of need? That would be the Cached memory – Shared memory that is 2116 Mb.
This can also be calculated also from /proc/meminfo easily by the difference between Cached and Shmem 13114880 kb – 10946292 kb = 2118 Mb

Additional information:

1382721 – Linux: Interpreting the output of the command ‘free’